While checking the details of the conjunction online I noticed that, while most sources gave a good idea of how close the meeting would be, few mentioned the precise time of closest approach - and those that did so had very different answers. I thus decided to see whether I could calculate the time from images of the conjunction taken on a number of days centred on 21st December ("conjunction day"). By aligning the images (using the starry background as a guide) and measuring the positions of Jupiter and Saturn on each I hoped to calculate when Jupiter just overtook Saturn as they both moved across the sky on their separate paths. Unfortunately, as mentioned on the main Great Conjunction page, because of overcast weather conditions I was only able to get pictures on just two days - 19th & 20th December. I felt all was not lost though, as perhaps I could use plots of the situation as generated by planetarium-type programs instead. The programs I had used previously were not flexible enough for what I had in mind, so after a bit of online searching I found and installed C2A, a free program with many useful features, and used this to generate the views of the sky I needed.
There are basically two ways to calculate closest approaches using images generated by planetarium-type programs, with the second one being divided into two sub-methods:-
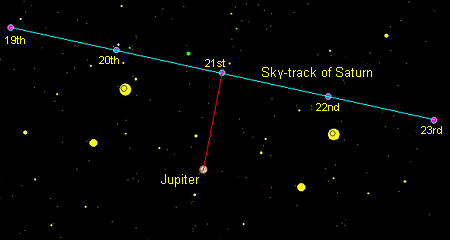
1) Arrange for each of the views to be centred on one of the planets (so it remains in the same position in each view) and construct a composite image from all of the separate views by combining them in an image stacking program. On the composite, plot the path of the other planet as it moves past the stationary one. Then, draw a line from the stationary planet to the plotted path, ensuring it meets the path at right-angles, thus determining the point on the path which is nearest to the stationary planet. Finally calculate the time instant to which this point corresponds. This might be called the "geometric" approach. The general idea is shown below - images from 19th to 23rd December with Jupiter in the same position each time are superimposed, the track of Saturn is plotted, and a line is drawn from one to the other.

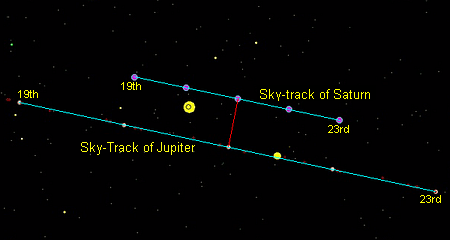
2A) By direct measurement from the generated views, determine a) the distance (in pixels) each planet moves in the time period used and b) the distance the faster planet is behind the slower one at the start of the period. The total distance divided by the time gives the speed at which each planet is moving, and this can be used together with the "head start" the slower one has to calculate when the faster-moving one will catch it up. I have called this approach the Zeno method, as it harks back to the story of Achilles and the Tortoise as used in a famous paradox posed by the Greek philosopher Zeno. You can read about it here. Again, the general idea is shown below. The tracks of both planets are plotted, and the point at which the faster moving Jupiter overtakes Saturn (shown by the red line) is calculated, given the headstart Saturn has on the 19th and the relative speed between them.

2B) Employ the Zeno method but instead of determining positions and distances by direct measurement from the generated views, do so by calculation from the celestial coordinates of the planets at each instant.
One can, of course, also use planetarium programs directly by getting them to calculate the distance between the planets and gradually change the time until the distance is minimised. However, programs such as C2A do not present distances to a sufficient degree of resolution to give this method an acceptable level of accuracy - for example, its tool for measuring separations only shows the distance to whole arc-seconds (where there are 60 arc-seconds in an arc-minute and 60 arc-minutes in a degree). One arc-second is actually a very small distance but this conjunction was so close that it took quite some time for the separation to change by as much as a whole arc-second. In fact, C2A showed the separation as being 367 seconds of arc from 17:05 right until 19:48, so while one might reasonably guess that closest approach was half-way between those times (i.e. 18:26:30) that would hardly be convincing. I thus had to use a much more sophisticated program, called Solex, a program designed to calculate planetary positions to almost absurd precision by using the laws of physics and numerical integration rather than simple sets of orbital elements.
This all sounds quite straightforward but, as I found out, each method quickly becomes mired in practical problems! How I attempted to resolve these might perhaps be interesting to some, so if you enjoy minutiae and have too much time on your hands click here to learn more. For those who just want to know the basic details, what follows is an "Executive Précis" of my results.
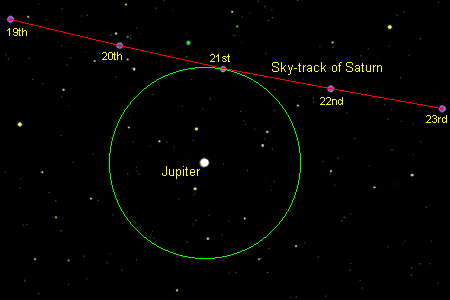
I quickly found that, although the Zeno method is conceptually straightforward, applying it to actual data has so many practical problems that it's not really worth using. While there is a whole range of potential corrections one might consider taking into account, including allowing for the variable speed of planets across the sky and the fact that their sky-tracks are neither exactly straight lines nor perfectly parallel, I found that some of them improved the result while others did not - most frustrating. Fortunately, there is a very straightforward alternative available. This is a variant of the Geometric method, when instead of extending a line up from Jupiter to the track of Saturn a circle centred on Jupiter is slowly expanded until it touches Saturn's sky-track. The diagram below shows what I mean.

This method gives good results with almost no need for corrections other than just ensuring that the images used to generate the final composite from which to work are consistently produced (both Roger & I found that the diagrams which planetarium-type programs draw don't always have exactly the same arc-sec/pixel resolution!). Also, it is capable of giving improved results the greater the pixel resolution of the images used, as the accuracy depends solely on an estimate of when one drawn line meets another rather than the complex calculations needed by the Zeno method. The fact that Roger & I came up with essentially the same result using totally different base images and working independently tends to support the view that the "Expanding Circle Geometric" method is accurate, repeatable and easy to use.
Because of the problems with the Zeno method, the results it gave were not consistent between using the diagrams produced by C2A and using actual Right Ascension and Declination figures for the two planets, particularly as these approaches required the use of different correction factors. The Geometric method used just the diagrams though, so I shall quote only the results obtained from this type of base image as I feel they are more likely to be comparable. So, we have:-
| METHOD | RESULT | OFFSET |
|---|---|---|
| GEOMETRIC | ||
| Using a rotated composite of scale-corrected C2A plots centred on Jupiter, "expanding circle" method | 17:57:33 | +3.79mins |
| Using a rotated composite of scale-corrected actual observation images centred on Jupiter, "expanding circle" method (Roger's result) | 17:57 | |
| ZENO | ||
| Using individual rotated C2A plots for 19th & 23rd December, with the measurements corrected for scale errors and the result corrected for variation in speed | 17:51:04 | ‑2.67mins |
| ASTRONOMY PROGRAMS | ||
| Solex, linear geometry | 17:53:45 | |
| Solex, spherical geometry | 18:27:38 | |
| Estimate from C2A, spherical geometry | 18:26:30 | |
Note that I have given two results from Solex - in "linear" and "spherical" geometry. This is because for an observer on the Earth all the celestial bodies seem to be moving across the surface of a hemispherical dome above our heads, with us at its centre. When viewing a small section of this dome one's impression is that everything is on a flat sheet rather than a curved surface and of course for photographs of the night sky or diagrams produced by planetarium programs such as C2A this is literally true. These two viewpoints dictate the use of two different forms of geometry to measure movement across them - linear for the flat sheet situation and spherical for visual observations or the measurements produced by C2A, which give the distance "around the dome" rather than "point to point".
The Zeno and Geometric methods both used the same base data (the plots produced by C2A) so it's perhaps not unreasonable to suggest that a final answer might be found by taking an average between them, which comes out to 17:54:19, just 1.12 minutes later than the Solex answer. This compares very well to the spherical geometry estimate derived from C2A which was 1.13 minutes early. Probably just a happy coincidence, but I'll take that!